Google Data GIF Maker


Google Data GIF Maker: Not Sophisticated, Potentially Misleading?
“Google Data GIF Maker – BEWARE,” animated GIF by @aforgrave

A couple days ago I wrote a post entitled Google Data GIF Maker: Not Ready for Prime Time. I was intrigued with the ease with which it created a nice animatedGIF.

However, I was:

  1. confused by the limited documentation;
  2. perhaps mislead a bit by the interface;
  3. concerned about the results it produced.

I continued to poke around a bit more in the days that followed. I wanted to understand how the tool might be processing a set of values and deriving the visualization. I submitted the following data set to the tool:
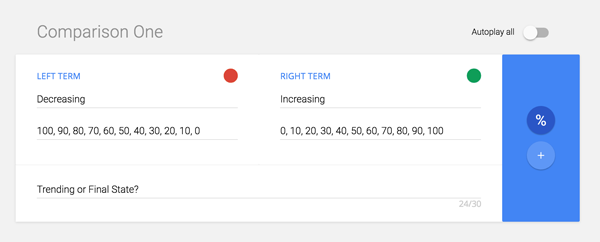
“What will the Google Data GIF Maker do with this data?” capture by @aforgrave

The Data GIF Maker generated the following:

“Increasing & Decreasing Data: What does this show?” animated GIF by Google Data GIF Maker

Clearly, something didn’t seem to be jiving with my expectations.  Yes, there is a trending from right to left (green increasing, red decreasing), but what does the final state mean with red at 0% and green at 100% yet displaying bars of relative width at a ratio of 1:4? (I counted pixels. 120 red, 480 green for a 600 pixel wide GIF.)  This seems remarkably similar to that odd 80% that I kept arriving at in the previous post, and is very misleading. What’s going on?
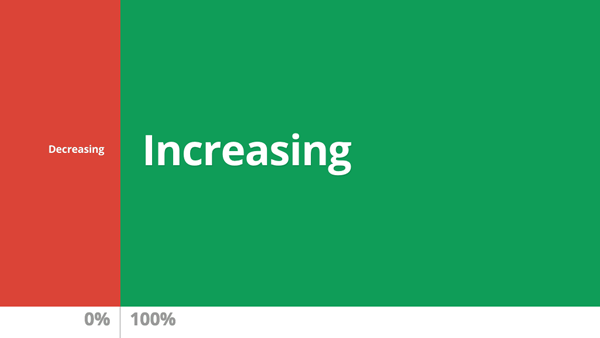
“What Does This Represent?” (final state of data GIF)

This morning I followed the breadcrumbs back to the original source post upon which the rest of the Internet had based its promotions. The post, Make Your Own Data GIFs with Our New Tool, was authored by Simon Rogers, (@smfrogers, on Twitter) Data Editor at the Google News Lab. I noted a couple of details in his post which seemed new to my understanding — and critically important.

First, the post clearly provides simple numbered instructions — something that seemed to be lacking in the re-hashed third-party blog posts I originally read. The first numbered instruction is clearly at odds with the instruction within the Data GIF Maker interface.

Where Simon’s instructions state “1. Enter two data points,” the interface instead provides two fields, with each asking for “Values (comma-separated).”

Second, the title bar on the page also seems at odds with the actual function.

Whereas the title bar reads “Trends Visualization Tool,”  the details in Simon’s post state “If you want to show search interest, you can compare two terms in the Google Trends explore tool, which will give you an average number (of search interest over time) for each term (emphasis added). Then input those two numbers in Data Gif Maker.”  In other words, calculate the average values for your two sets of data, and put them in here. What? No trend over time is actually assessed by the tool?

So, for all the appearance of taking sets of data and showing how they change over time, my previous suggestion that the tool simply animates a wobble back and forth seemed to be actually in tune with what the tool was designed to do, namely, given two data points, provide a flashy, eye-catching wobble that arrives at a clearly determined comparative ratio. No real data crunching happening here folks. No trend being visualized. Nothing to see here. Carry on.

Note, however, that this tool is aimed at journalists, and offers them a way to quickly create visualization that suggests a trend or a change over time (“Trends Visualization Tool”). Without proper understanding and application, such a tool could very easily create a very misleading effect, unintentionally or otherwise.  As readers and consumers of media, we need to beware anything that could be misleading.

In closing, consider the same data provided above, but crunched as per the instructions.

“Crunch the Data the Google Trends Way,” animated GIF by @aforgrave

Does the following Google Data GIF Maker product in any way visualize either the trend OR the end state as reflected in the data?

“Trend? Final State? Or Just Two Averages? ” animated GIF by Google Data GIF Maker

I would like to see this tool evolve to do what I had originally hoped it was doing. I don’t think the code required would be all that difficult to implement.

However, I do believe that Google needs to be really clear up front with us about:

  1. how they want folks to be able to use the tool;
  2. what the tool is actually doing;
  3. and most importantly, what their understanding is of how the general population will interpret the results.

I’m going to forward this post to a few folks who have a lot more time and experience invested in Data Visualization than I do. Perhaps they can chime in and let us know where this might be going over time.

Attribution

Masterplan font by Billy Argel from fontspace.com  (licensed as Freeware, Non-Commercial)


Google Data GIF Maker: Not Ready for Prime Time? 1

Interface for Google’s Data GIF Maker, screen capture by @aforgrave


June 3rd: This is now the first of two posts on this topic. The second post, Google Data GIF Maker: Not Sophisticated, Potentially Misleading, documents some additional investigation. Please consider the two posts in tandem.

Given my fondness for making animated GIFS (see posts tagged animatedGIF on my de•tri•tus blog), the announcement of the Google Data GIF Maker last week had my attention from the start. It looked like a really cool tool for visualizing the relative quantities of two sets of data (two web search topics, say, or the frequency of tweets from two different Twitter accounts). No sooner had I seen it, than Doug Peterson (@dougpete, on Twitter) tweeted about it and mentioned me to make sure I knew about it.

I poked around with the tool, but lacking any documentation (and not finding any in the articles (here’s one, here’s another) that had been posted to announce it), I was flying blind as I tried to get it to work. Did it draw the values from a couple of search URLs? Nope. I looked at the examples. With two numbers (one in each of the Values fields) that summed to 100, it would wobble back and forth and end up with a split representing their relative fraction of the whole. But clearly it must do more than that! It was asking for comma separated data values. Hmmmm. Clearly I needed two sets of relative data that it could compare!

Peter McAsh (@pmcash, on Twitter)was kind enough to download an archive of the @BringIT2017 Twitter account for me to compare with the data that I have from the sister @ecooWeb Twitter account. I spent a few minutes formatting the monthly data into comma-separated values, and then unleashed the tool on the data. The fan came on my laptop, the web tool ground away for numerous minutes, and then it gave me this:

Comparing Tweets by Month, 2015, for @BringIT2015 and @ecooWeb, generated with Google Data GIF Maker (GIF is 4.6 MB!)

It looked nice, but somehow, the data representation didn’t look right. Despite one number significantly dwarfing the other, the visual splits seemed to be somewhat arbitrary.

I tried again using data from 2016, which I knew from inspection was even more offset in favour of @BringIT2016. Still, it didn’t seem right at all.

Comparing Tweets by Month, 2016, for @BringIT2016 and @ecooWeb, generated with Google Data GIF Maker (4.7 MB)

I was also puzzled by the fact that both years resulted in an 80/20 split — Not only did that seem highly coincidental, but I also knew that it was not correct. Maybe I was misunderstanding the tool? I tried the 2016 data again using the “+” option rather than the “%” option. Hmmm.

Comparing Tweets by Month, 2016, for @BringIT2016 and @ecooWeb — using + versus %, generated with Google Data GIF Maker (4.6 MB)

Was the %/+ nothing more than a numerical unit in the footer? Perhaps it has NO effect on the function of the tool.

By this point, I was actively questioning whether the Data GIF Maker was even representing the provided data in the GIF, or perhaps it was simply animating the wobble back and forth and just listing data points in the footer. (I knew the answer — and realized that I could simply confirm my belief by grabbing a single frame from the gif — see below), but I wanted to press on and see if I could actually get the tool to accurately represent the data. Maybe the Data GIF Maker wasn’t as smart as I was expecting it to be? I was assuming that it would take the two corresponding data points from the two lists, do a mathematical comparison on each to generate their relative fractions A/(A+B) and B/(A+B) and express/draw them as percents of the total width — but perhaps I needed to present the data already pre-calculated for it? I transferred my data into a spreadsheet, performed the calculations, and re exported the data as percentages of the total into two pre-compared lists.

Data re-transferred into percentages, for the period January 2015 through to May 2017.

Here is the final result.

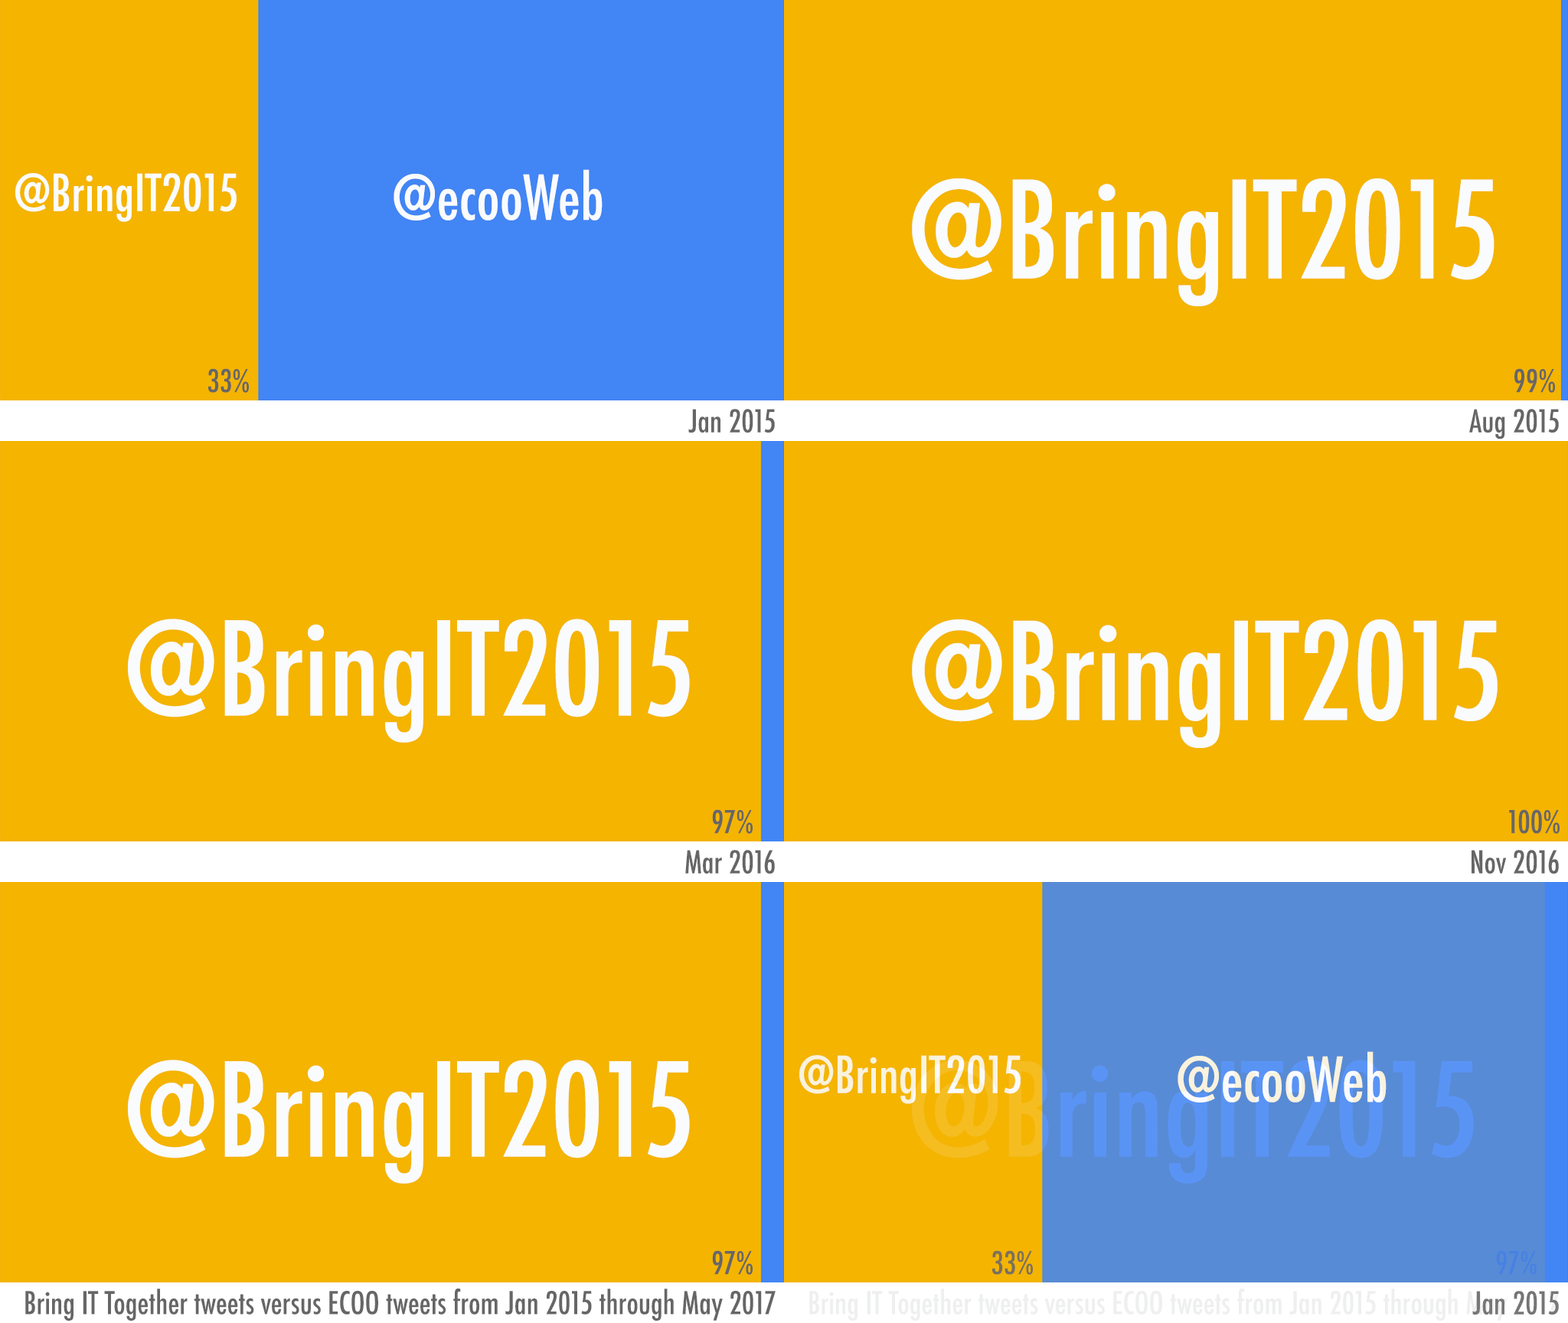
Comparing Tweets, Relative Percentage, Jan 2015 to May 2017, for @BringIT2016 and @ecooWeb, generated with Google Data GIF Maker (4.6 MB)

Yeah. The animated representation is all glitz, and doesn’t accurately represent the true data at all. That’s really too bad. Here is the same GIF, but I have slowed down the frames so that you can see the percentages listed and compare them with the relative proportions of the whole. They are completely arbitrary and way out of whack!

Comparing Tweets, Relative Percentage, Jan 2015 to May 2017, generated with Google Data GIF Maker — GIF frames slowed down. (733 kb! Much better!)

The Google Data GIF Maker might look cool, but it is extremely misleading!

I spent a few minutes with a spreadsheet tool to create a stacked bar graph, and then took the resulting graph into Photoshop to create what I had actually hoped the Data GIF Maker was doing. Here is my own animated GIF of the actual data, represented in proper proportions of the width/area.  Enjoy!

My own data GIF of the same figures, created using Excel and Photoshop, by @aforgrave  (435 KB, and that’s at 256 colours!)

Some notes regarding the GIFs created by the Google Data GIF Maker:

  • The GIF files are huge – on the order of 4-5 MB each.
  • To get the smooth animation, they have a lot of frames, literally hundreds of frames for 12 pairs of data points.
  • The files don’t use an optimized colour palette, which also increases file size considerably. They could easily get away with an 8 colour palette.
  • All those decimals in the percentages suggest a precision that doesn’t exist in the data.
  • And again, they emphasize glitz at the expense of accurately representing the data. It’s nowhere close.

I’m keen to see the Data GIF maker evolve, as it certainly creates a nice product with much less effort than is required to do the same task manually. However, for the time being, the fact that it doesn’t accurately show the data is a deal breaker.

Here’s hoping the code will evolve to address that!