Google Data GIF Maker: Not Sophisticated, Potentially Misleading?

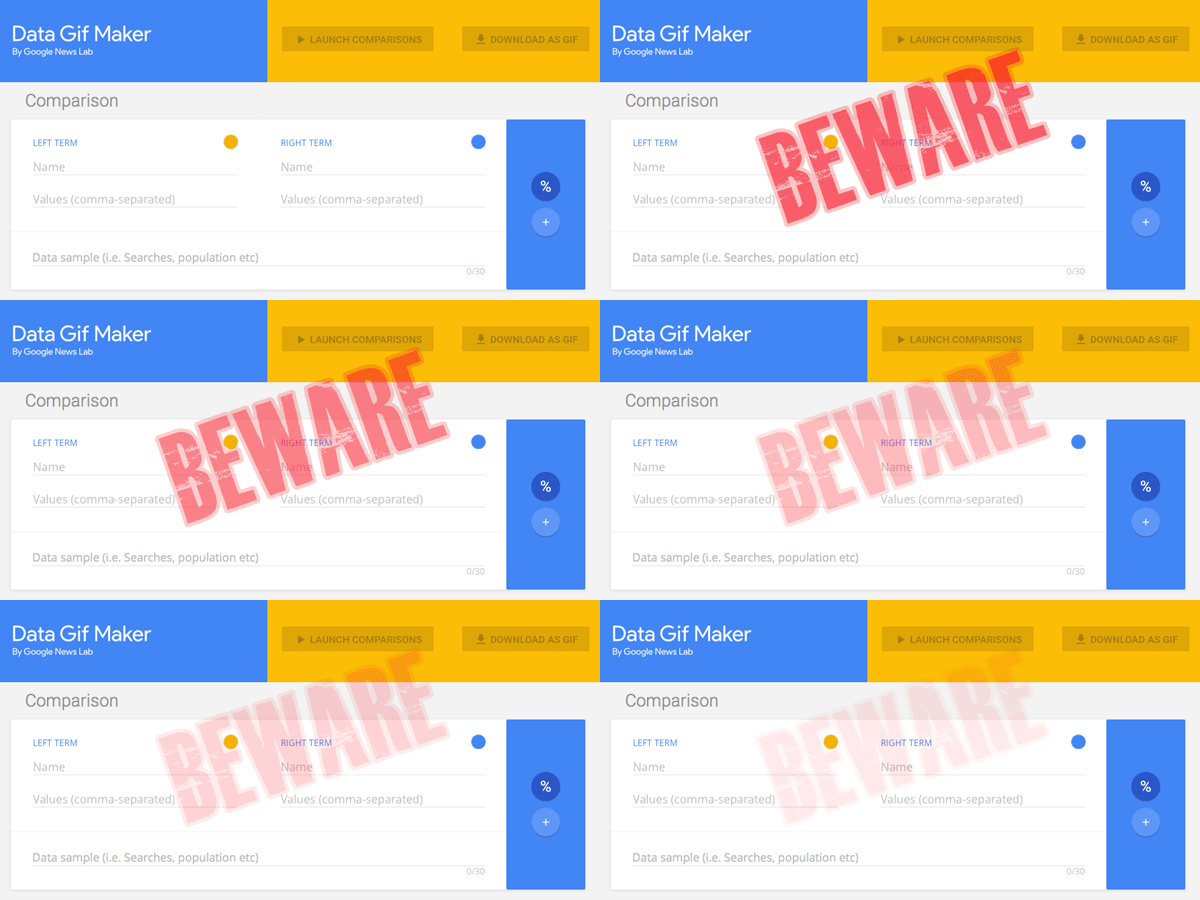
“Google Data GIF Maker – BEWARE,” animated GIF by @aforgrave
A couple days ago I wrote a post entitled Google Data GIF Maker: Not Ready for Prime Time. I was intrigued with the ease with which it created a nice animatedGIF.
However, I was:
- confused by the limited documentation;
- perhaps mislead a bit by the interface;
- concerned about the results it produced.
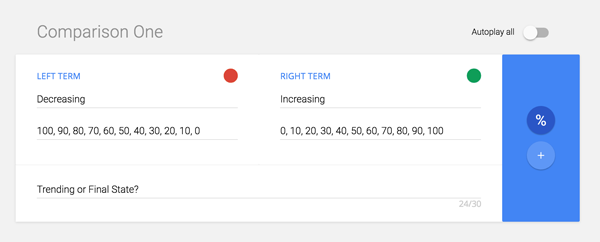
I continued to poke around a bit more in the days that followed. I wanted to understand how the tool might be processing a set of values and deriving the visualization. I submitted the following data set to the tool:

“What will the Google Data GIF Maker do with this data?” capture by @aforgrave
The Data GIF Maker generated the following:

“Increasing & Decreasing Data: What does this show?” animated GIF by Google Data GIF Maker
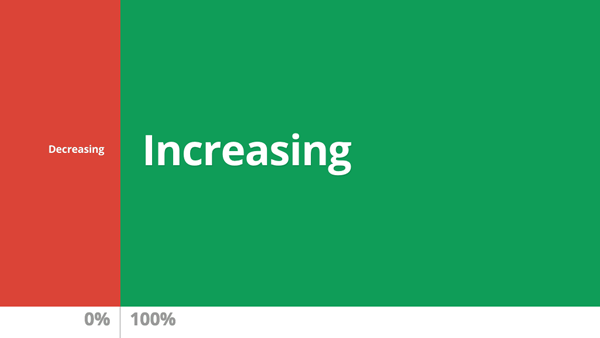
Clearly, something didn’t seem to be jiving with my expectations. Yes, there is a trending from right to left (green increasing, red decreasing), but what does the final state mean with red at 0% and green at 100% yet displaying bars of relative width at a ratio of 1:4? (I counted pixels. 120 red, 480 green for a 600 pixel wide GIF.) This seems remarkably similar to that odd 80% that I kept arriving at in the previous post, and is very misleading. What’s going on?

“What Does This Represent?” (final state of data GIF)
This morning I followed the breadcrumbs back to the original source post upon which the rest of the Internet had based its promotions. The post, Make Your Own Data GIFs with Our New Tool, was authored by Simon Rogers, (@smfrogers, on Twitter) Data Editor at the Google News Lab. I noted a couple of details in his post which seemed new to my understanding — and critically important.
First, the post clearly provides simple numbered instructions — something that seemed to be lacking in the re-hashed third-party blog posts I originally read. The first numbered instruction is clearly at odds with the instruction within the Data GIF Maker interface.
Where Simon’s instructions state “1. Enter two data points,” the interface instead provides two fields, with each asking for “Values (comma-separated).”
Second, the title bar on the page also seems at odds with the actual function.

Whereas the title bar reads “Trends Visualization Tool,” the details in Simon’s post state “If you want to show search interest, you can compare two terms in the Google Trends explore tool, which will give you an average number (of search interest over time) for each term (emphasis added). Then input those two numbers in Data Gif Maker.” In other words, calculate the average values for your two sets of data, and put them in here. What? No trend over time is actually assessed by the tool?
So, for all the appearance of taking sets of data and showing how they change over time, my previous suggestion that the tool simply animates a wobble back and forth seemed to be actually in tune with what the tool was designed to do, namely, given two data points, provide a flashy, eye-catching wobble that arrives at a clearly determined comparative ratio. No real data crunching happening here folks. No trend being visualized. Nothing to see here. Carry on.
Note, however, that this tool is aimed at journalists, and offers them a way to quickly create visualization that suggests a trend or a change over time (“Trends Visualization Tool”). Without proper understanding and application, such a tool could very easily create a very misleading effect, unintentionally or otherwise. As readers and consumers of media, we need to beware anything that could be misleading.
In closing, consider the same data provided above, but crunched as per the instructions.
“Crunch the Data the Google Trends Way,” animated GIF by @aforgrave
Does the following Google Data GIF Maker product in any way visualize either the trend OR the end state as reflected in the data?

“Trend? Final State? Or Just Two Averages? ” animated GIF by Google Data GIF Maker
I would like to see this tool evolve to do what I had originally hoped it was doing. I don’t think the code required would be all that difficult to implement.
However, I do believe that Google needs to be really clear up front with us about:
- how they want folks to be able to use the tool;
- what the tool is actually doing;
- and most importantly, what their understanding is of how the general population will interpret the results.
I’m going to forward this post to a few folks who have a lot more time and experience invested in Data Visualization than I do. Perhaps they can chime in and let us know where this might be going over time.
Attribution
Masterplan font by Billy Argel from fontspace.com (licensed as Freeware, Non-Commercial)


